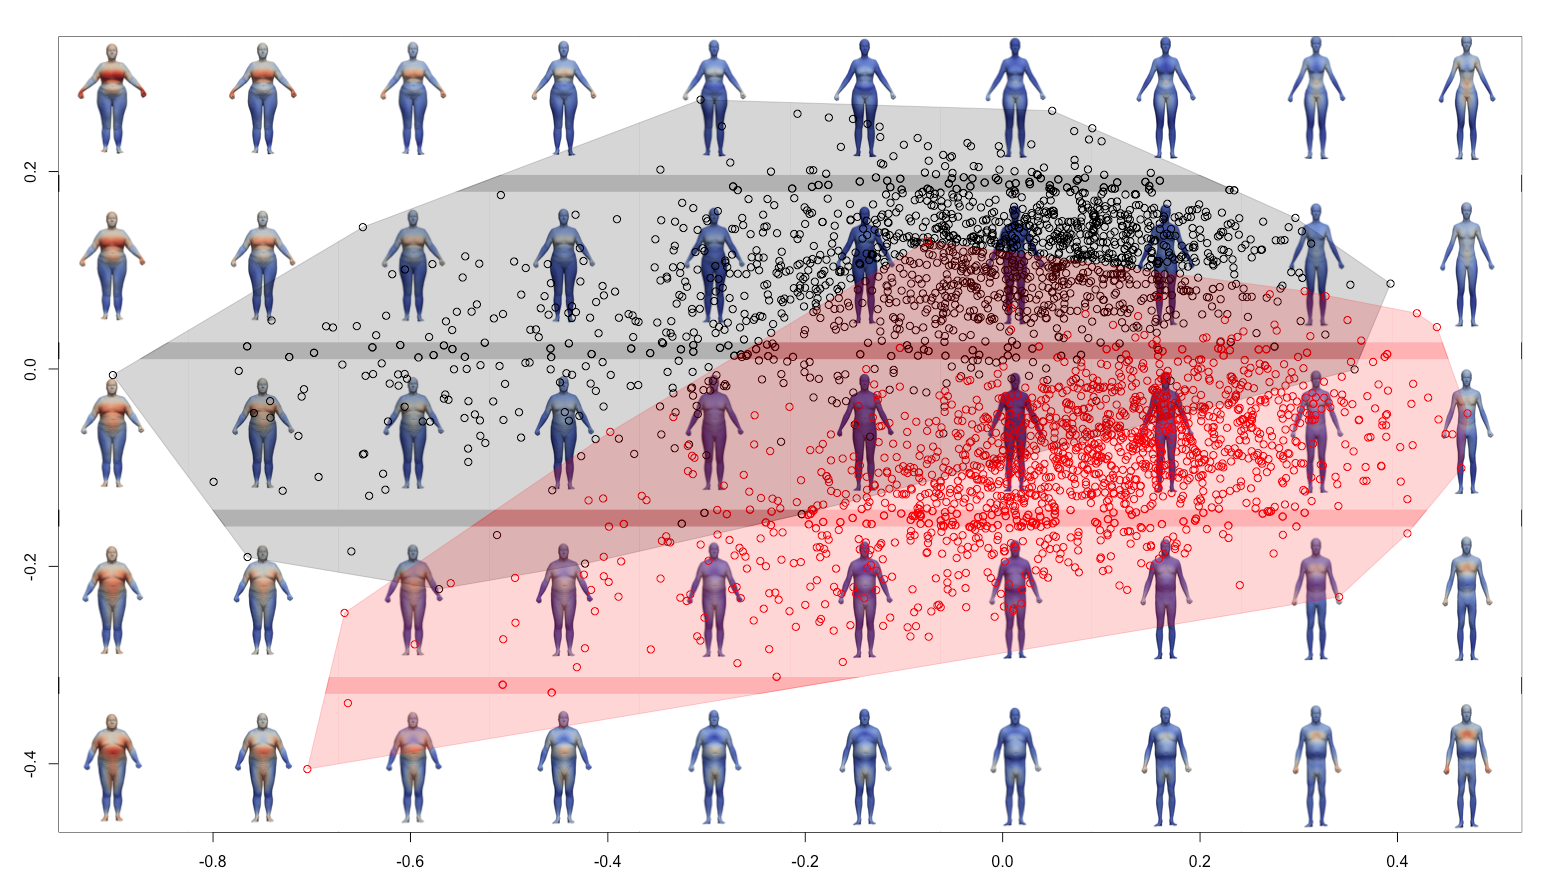
PCA allos to study the relationship between the specimens. As each point from the PCA corresponds to a shape, it is then possible to display shapes onto the PCA space, it is called the morphospace. To do it, one needs to get the deformations associated to each point, then shooting the shapes and then to display the shape onto the PCA.
To get the assiociated deformation (see main_morphospace01.R):
library(RToolsForDeformetrica)

###############

NumberOfSubject = 3045# number of subjects (pooled)

group = as.factor(c(rep(1,times=1531),rep(2,times=1514)))

KernelWidth = 0.1# kernel width of the deformation kernel

#MomentaPathname = file.choose()

MomentaPathname = '../output/DeterministicAtlas__EstimatedParameters__Momenta.txt'

# ControlPointsPathname = file.choose()

ControlPointsPathname = '../output/DeterministicAtlas__EstimatedParameters__ControlPoints.txt'

##############

Momenta = import_momenta(MomentaPathname, NumberOfSubject)

ControlPoints = import_control_points(ControlPointsPathname)

velocities = compute_velocities(Momenta$momenta, ControlPoints, KernelWidth)

ColumnMean = colMeans(velocities$V)

velocitiesC = velocities$V-matrix(rep(ColumnMean,nrow(velocities$V)),nrow=nrow(velocities$V),ncol=ncol(velocities$V),byrow=TRUE)

gp = prcomp(velocitiesC,scale = FALSE,center=FALSE)

KInv = chol2inv(chol(velocities$K))

xrange = seq(from = min(gp$x[,1]), to = max(gp$x[,1]), length = 10)

yrange = seq(from = min(gp$x[,2]), to = max(gp$x[,2]), length = 5)

cpt1 = 1

cpt2 = 1

for (k in xrange){

  for (m in yrange){

    dots = c(k,m,numeric(dim(gp$x)[2]-2))

    vInter = score2velocities(dots,gp,ColumnMean)

    dir.create(sprintf("%03d_%03d",cpt1,cpt2))

    filename = file.path(sprintf("%03d_%03d",cpt1,cpt2),sprintf("MOM_%03d_%03d.txt",cpt1,cpt2))

    conformations(vInter, Momenta$momenta, ControlPoints, KernelWidth, filename, KInv)

    file.copy(ControlPointsPathname,file.path(sprintf("%03d_%03d",cpt1,cpt2),basename(ControlPointsPathname)))

    cpt2 = cpt2 + 1

  }

  cpt2 = 1

  cpt1 = cpt1 + 1

}
The code generate .txt files into folders and one needs to manually copy the following files: eterministicAtlas__EstimatedParameters__Template_body.vtk, launch.sh, model.xml (modify it following the name of MOM) and optimization_parameters.xml. Compute the shape by running each launch.sh.
To add the colormaps, one can use:
python add_colormap_folders_shooting.py
Then one can generate images by using:
python screenshot_bodymodels.py
Then one can display the plot with R (into main_morphospace02.R):
library(RToolsForDeformetrica)

library(png)

###############

NumberOfSubject = 3045# number of subjects (pooled)

group = as.factor(c(rep(1,times=1531),rep(2,times=1514)))

KernelWidth = 0.1# kernel width of the deformation kernel

#MomentaPathname = file.choose()

MomentaPathname = '../output/DeterministicAtlas__EstimatedParameters__Momenta.txt'

# ControlPointsPathname = file.choose()

ControlPointsPathname = '../output/DeterministicAtlas__EstimatedParameters__ControlPoints.txt'

##############

Momenta = import_momenta(MomentaPathname, NumberOfSubject)

ControlPoints = import_control_points(ControlPointsPathname)

velocities = compute_velocities(Momenta$momenta, ControlPoints, KernelWidth)

ColumnMean = colMeans(velocities$V)

velocitiesC = velocities$V-matrix(rep(ColumnMean,nrow(velocities$V)),nrow=nrow(velocities$V),ncol=ncol(velocities$V),byrow=TRUE)

gp = prcomp(velocitiesC,scale = FALSE,center=FALSE)

plot(gp$x[,1],gp$x[,2],asp=1,pch=1,col=group, xlab="", ylab="", ylim=c(-0.5, 0.4))

convex_hull(gp$x, group)

xrange = seq(from = min(gp$x[,1]), to = max(gp$x[,1]), length = 10)

yrange = seq(from = min(gp$x[,2]), to = max(gp$x[,2]), length = 5)

step = xrange[2]-xrange[1]

pngfiles = list.files('./morphospace_images/','*.png')

cpt = 1

for (k in seq(1,10)){

  for (m in seq(1,5)){

    pic <- readPNG(file.path('./morphospace_images',pngfiles[cpt]))
    rasterImage(pic,xrange[k]-step/2,yrange[m]-step/2,xrange[k]+step/2,yrange[m]+step/2)
    cpt = cpt+1
  }
}
points(gp$x[,1],gp$x[,2],asp=1,pch=1,col=group, xlab="", ylab="")
convex_hull(gp$x, group)