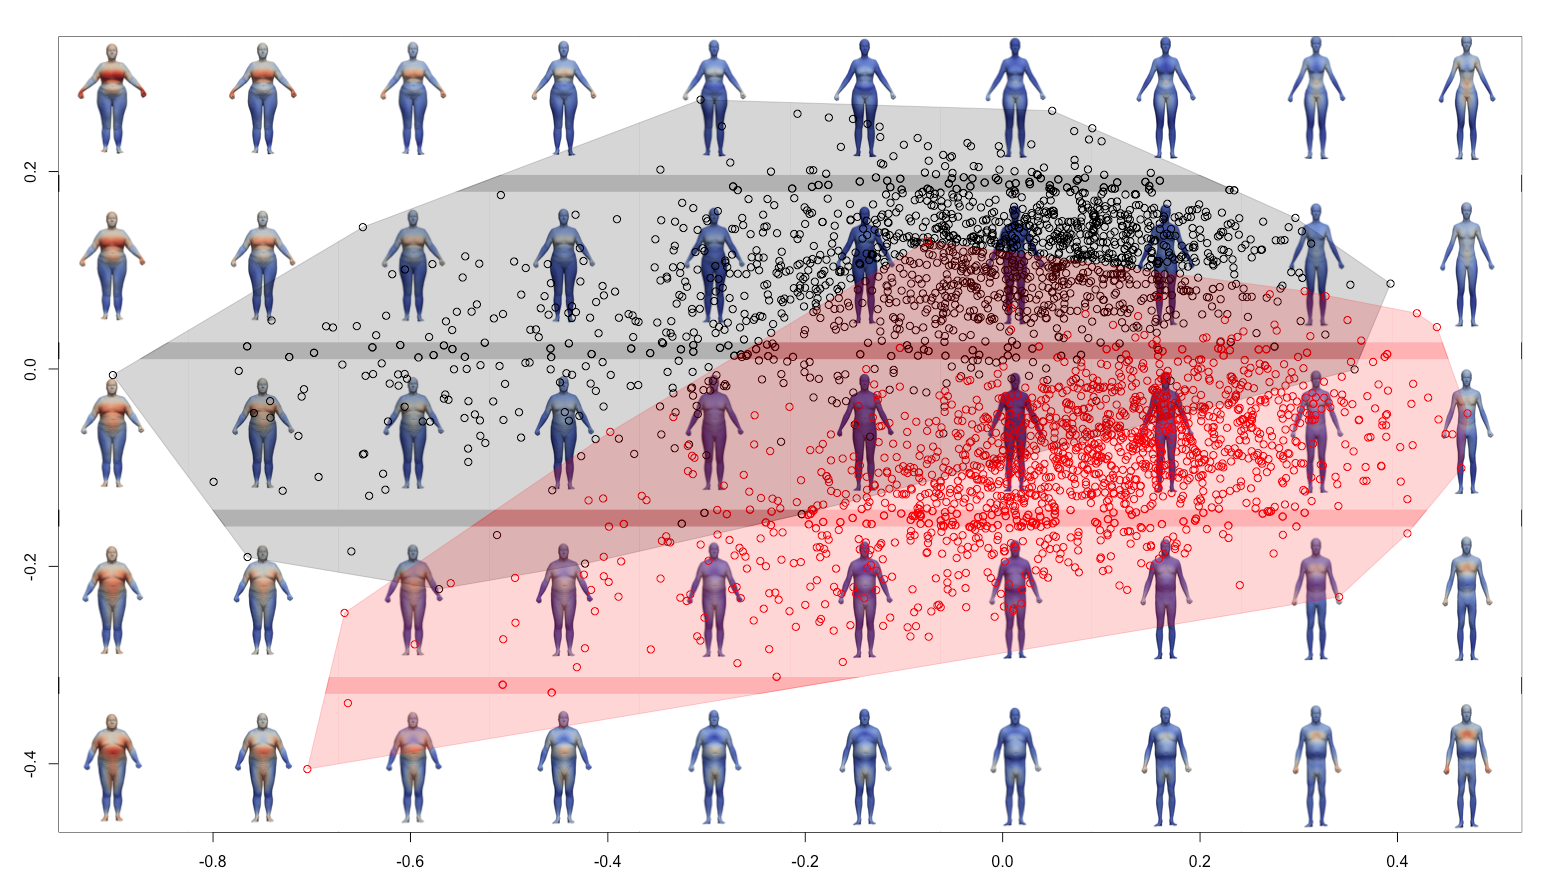
Nous avons vu que l’ACP permet d’analyser les relations entre les individus de notre échantillon. A chaque point de l’ACP correspond une forme géométrique, il est alors possible de superposer les formes géométriques dans l’espace de l’ACP. Pour cela, il va falloir générer les déformations associées à chaque point considéré, puis en déduire les formes et intégrer des images sur le graphique de l’ACP.
Pour générer les déformations associées (dans main_morphospace01.R) :
library(RToolsForDeformetrica)

###############

NumberOfSubject = 3045# number of subjects (pooled)

group = as.factor(c(rep(1,times=1531),rep(2,times=1514)))

KernelWidth = 0.1# kernel width of the deformation kernel

#MomentaPathname = file.choose()

MomentaPathname = '../output/DeterministicAtlas__EstimatedParameters__Momenta.txt'

# ControlPointsPathname = file.choose()

ControlPointsPathname = '../output/DeterministicAtlas__EstimatedParameters__ControlPoints.txt'

##############

Momenta = import_momenta(MomentaPathname, NumberOfSubject)

ControlPoints = import_control_points(ControlPointsPathname)

velocities = compute_velocities(Momenta$momenta, ControlPoints, KernelWidth)

ColumnMean = colMeans(velocities$V)

velocitiesC = velocities$V-matrix(rep(ColumnMean,nrow(velocities$V)),nrow=nrow(velocities$V),ncol=ncol(velocities$V),byrow=TRUE)

gp = prcomp(velocitiesC,scale = FALSE,center=FALSE)

KInv = chol2inv(chol(velocities$K))

xrange = seq(from = min(gp$x[,1]), to = max(gp$x[,1]), length = 10)

yrange = seq(from = min(gp$x[,2]), to = max(gp$x[,2]), length = 5)

cpt1 = 1

cpt2 = 1

for (k in xrange){

  for (m in yrange){

    dots = c(k,m,numeric(dim(gp$x)[2]-2))

    vInter = score2velocities(dots,gp,ColumnMean)

    dir.create(sprintf("%03d_%03d",cpt1,cpt2))

    filename = file.path(sprintf("%03d_%03d",cpt1,cpt2),sprintf("MOM_%03d_%03d.txt",cpt1,cpt2))

    conformations(vInter, Momenta$momenta, ControlPoints, KernelWidth, filename, KInv)

    file.copy(ControlPointsPathname,file.path(sprintf("%03d_%03d",cpt1,cpt2),basename(ControlPointsPathname)))

    cpt2 = cpt2 + 1

  }

  cpt2 = 1

  cpt1 = cpt1 + 1

}
Le programme génèrera des fichiers .txt dans des répertoires et il faudra copier manuellement les fichiers suivants : DeterministicAtlas__EstimatedParameters__Template_body.vtk, launch.sh, model.xml (à adapter selon le nom du fichier MOM) et optimization_parameters.xml. Faire ensuite les calculs en lançant chaque launch.sh.
Si l’on veut de la couleur, il faut utiliser :
python add_colormap_folders_shooting.py
Puis on peut générer les images en utilisant un programme :
python screenshot_bodymodels.py
Puis construire le graphique dans R (dans main_morphospace02.R) :
library(RToolsForDeformetrica)

library(png)

###############

NumberOfSubject = 3045# number of subjects (pooled)

group = as.factor(c(rep(1,times=1531),rep(2,times=1514)))

KernelWidth = 0.1# kernel width of the deformation kernel

#MomentaPathname = file.choose()

MomentaPathname = '../output/DeterministicAtlas__EstimatedParameters__Momenta.txt'

# ControlPointsPathname = file.choose()

ControlPointsPathname = '../output/DeterministicAtlas__EstimatedParameters__ControlPoints.txt'

##############

Momenta = import_momenta(MomentaPathname, NumberOfSubject)

ControlPoints = import_control_points(ControlPointsPathname)

velocities = compute_velocities(Momenta$momenta, ControlPoints, KernelWidth)

ColumnMean = colMeans(velocities$V)

velocitiesC = velocities$V-matrix(rep(ColumnMean,nrow(velocities$V)),nrow=nrow(velocities$V),ncol=ncol(velocities$V),byrow=TRUE)

gp = prcomp(velocitiesC,scale = FALSE,center=FALSE)

plot(gp$x[,1],gp$x[,2],asp=1,pch=1,col=group, xlab="", ylab="", ylim=c(-0.5, 0.4))

convex_hull(gp$x, group)

xrange = seq(from = min(gp$x[,1]), to = max(gp$x[,1]), length = 10)

yrange = seq(from = min(gp$x[,2]), to = max(gp$x[,2]), length = 5)

step = xrange[2]-xrange[1]

pngfiles = list.files('./morphospace_images/','*.png')

cpt = 1

for (k in seq(1,10)){

  for (m in seq(1,5)){

    pic <- readPNG(file.path('./morphospace_images',pngfiles[cpt]))
    rasterImage(pic,xrange[k]-step/2,yrange[m]-step/2,xrange[k]+step/2,yrange[m]+step/2)
    cpt = cpt+1
  }
}
points(gp$x[,1],gp$x[,2],asp=1,pch=1,col=group, xlab="", ylab="")
convex_hull(gp$x, group)